

By Felice Musicco & FORIERO
The questions:
What indicators to use in real world?
What data and IT tools to use?
What types of reports should be produced?
How are the drugs working?
The question is of primary interest to pharmacists, as they are responsible for various processes, from purchasing, to stock management, to appropriateness, to economic impact, to the relationship between benefits and risks. It is also of interest to prescribers and governance and decision-makers at the micro, meso and macro levels, i.e. hospital, regional and national.
Advanced data management based on the recording of indications for use, as well as the minimum information regarding the doses defined, prescribed and delivered, allows information and knowledge to be collected to be shared at various levels.
What indicators to use in real world?
The duration of treatments and adherence are the easiest validated indicators to use. The duration (generally TTD Time to Treatment Discontinuation) correlates with therapeutic failure, especially where the use of the drug is until resistance or toxicity that recommend its interruption. Adherence (ADH) to defined or prescribed doses is related to efficacy and therefore its reduction is frequently an indication of toxicity. Therefore, especially in the field of oncology, but not only, it is interesting to know the value of these indicators in treated patients, compare them with the results of experimental and observational studies, and use them in the context of therapeutic alternatives for the same clinical problem..
What data and IT tools to use?
The electronic management, linked to medical records, prescriptions and dispensing, offers an immense database for real-world studies. Extensive international literature has already been published offering evidence that computerized prescribing reduces medication errors and all Italian ministerial recommendations on drug risk reduction aim to promote it.
Analytical disbursements already used, for example, to provide monthly cost reporting (e.g. italian F-flow) are a minimum data set that allows TTD and ADH to be easily calculated from administrative databases. The integrations required of internal software, electronic calculation tools and preferably databases (db), consist in correlating the indication of use and other clinical data of interest for analysis and sub-analysis to the prescriptions and administrations data. In this sense, the database of treatments with a unique numerical identifier for each record must be linked to the database containing the fields for indications and clinical data. As it is, for example, the database of personal data which allows aggregate analysis by group considering age and gender.
The tools used by FORIERO include Excel spreadsheets, database access and the free statistical software statsdirect.
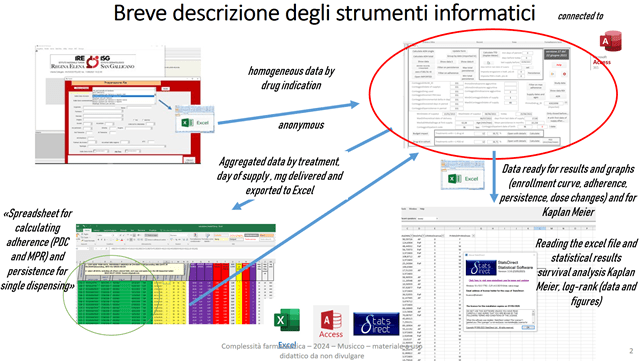
The source of the data is always an export to Excel of the data of the dispensing, starting from its company software. These processing with external tools can still be automated, customizing the company software. In this case without “clashing” with advanced uses of spreadsheets, db, tools for statistics, but having clear the key concepts for using and developing computer code.
The db access, specially prepared for drug use, has this opening interface:
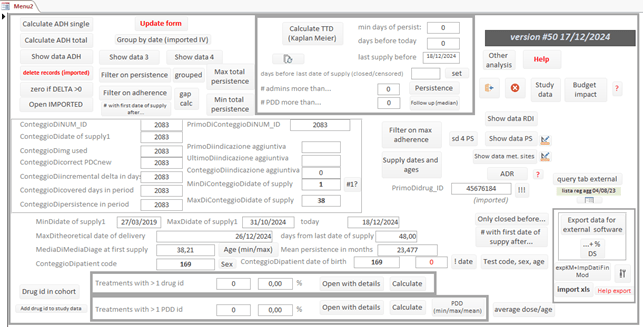
Once the excel table of the performance of the F flow has been connected to the db, it allows you to, among other things:
· Check the quality of the data to make the necessary corrections.
· Group dispensing by treatment (total daily milligrams by active ingredient and pharmaceutical form).
· Have immediate summary cohort data (number of treatments by gender, average age, dose changes, number of dispenses, unique dispenses).
· Have immediate information on the status of missed treatment days (gaps) in order to adequately set the best gap to calculate the median TTD with the Kaplan Meier method
· Calculate the mean and median ADH with the PDC and MPR methods, calculate the percentage dose intensity, calculate an estimate of the median TTD, calculate the percentage of patients treated at various times (3 months, 6 months, 1 year, two years, three years).
· Calculate, based on your current purchase prices, the expected economic impact, considering your own TTD and ADH cohort data.
· Display, by selecting the maximum reference value, the treatments with low adherence and dose intensity, linking them to the Excel sheet of the suspected ADRs.
· Pseudonymize the data, so that it can be used for presentations, reports, multicenter work.
· Export data in Excel format that can be immediately used with the statistical professional software statsdirect or to provide it to colleagues who use other statistical software.
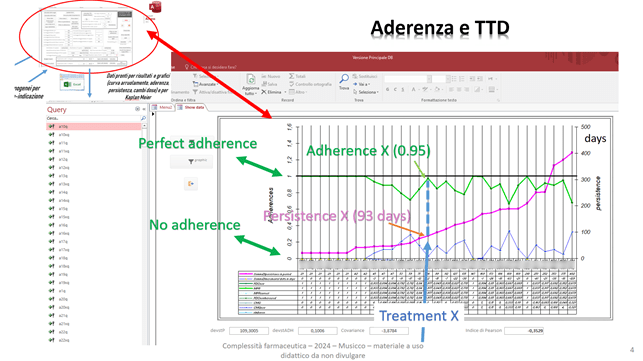
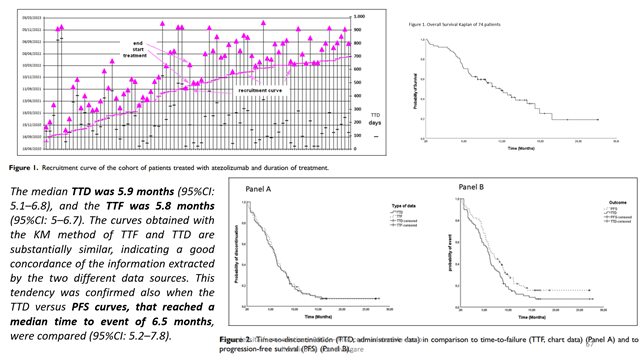
In particular, for drug-indication, our enrolment time curve with the durations of each treatment can be immediately obtained:
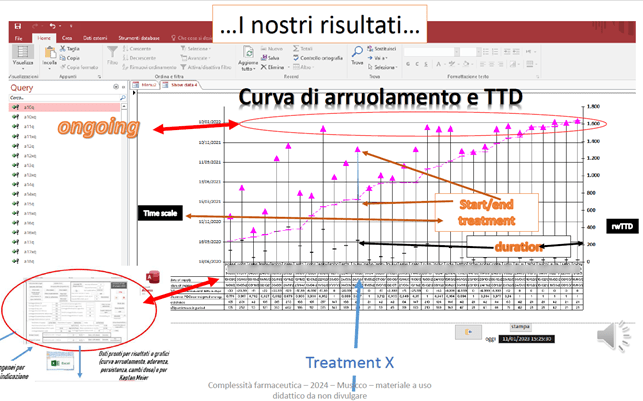
Each vertical line indicates a treatment with its start and date of last dispensing which can be read on the vertical axis on the left. See for example treatment X. The black dash indicates the TTD in days for each treatment, which can be read on the vertical axis on the right.
The figure makes it immediately visible how our treated population is responding to the drug, as the fuchsia tips at the top show us who is being treated at the time of the date of the last data extraction. The trend of the curve delimited by the fuchsia dashes that represent the beginning of the treatment, on the other hand, visually indicates how many treatments begin over time: the more inclined the trend is, the more they have begun, the more vertical it is, the fewer have begun in the period of time that can always be read on the left scale.
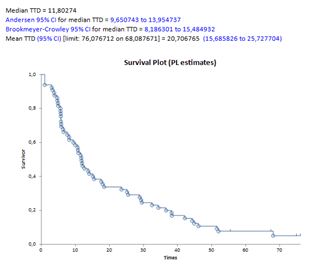
Clearly, the median reference value of the TTD must instead be calculated taking into account the appropriate time interval to consider the end events [Yes] or [No] according to the Kaplan Meier method. The software calculates an estimate of this value or prepares an export to Excel that can be processed with stasdirect in five minutes to obtain the curve, the value and the confidence intervals:
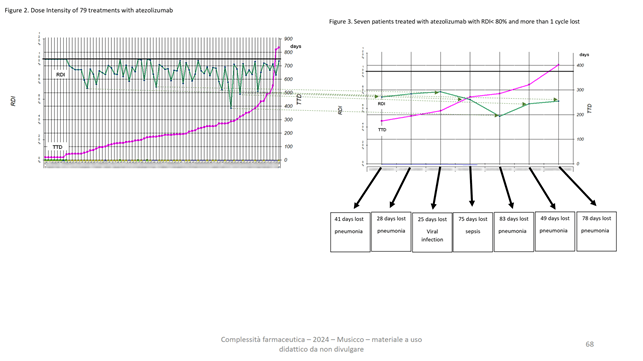
In addition, a figure is immediately obtainable that, for the same cohort, correlates TTD to adherence:
The treatments are always represented on the vertical lines and are sorted by increasing TTD. The TTD can be read, through the fuchsia dots, on the right axis; the adherence as PDC is instead read, with green dots, on the left axis. It varies between zero and one and see for example always treatment X.
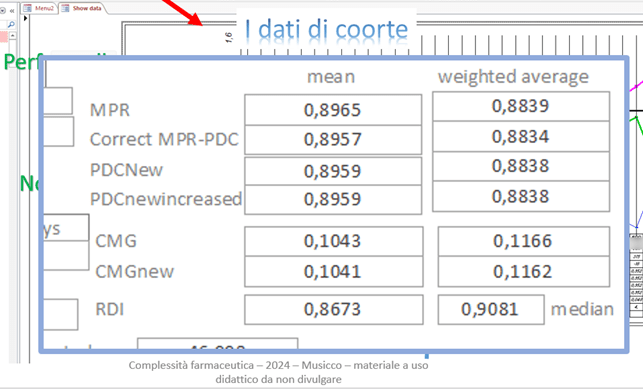
As noted above, adherence data across the entire cohort are clearly available as a mean, weighted average, and median, and using different indices of ADH from administrative data:
The FORIERO group has also developed an Excel spreadsheet that allows the calculation of duration and ADH data, dispensing by dispensing:
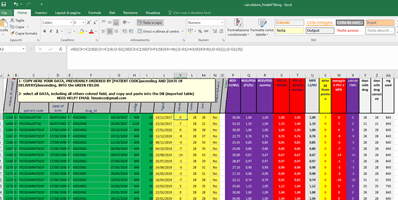
An algorithm takes into account the dates of actual dispensing and, based on the PDD or DDD, calculates delays or advances in supplies treatment by treatment, drug by drug.
The algorithm also takes into account early dispensing, allowing the calculation of a modified PDC that takes into account the early doses already delivered, which can be used in case of a delay in subsequent dispensing. The weighted average value of PDC calculated in this way is in the range between the PDC and the classically calculated MPR. It is clear that for each specific drug-indication considered, taking into account the recommended times and methods of delivery/administration, the most suitable method must be used, choosing between MPR, PDC and RDI.
What types of reports should be produced?
The essential use of these elaborations is the monitoring of any specific drug-indication in order to verify one’s own data and compare them with other centers, with experimental data, with data from other observational studies.
Below is a classic example of comparing our data with those from a similar recently published, observational and retrospective work:
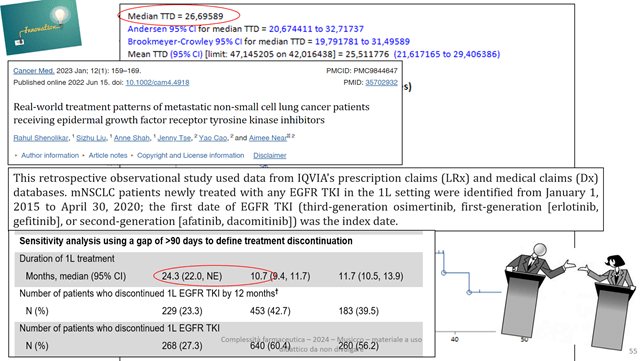
Our TTD and that from the article are circled.
In reality, the analyses carried out taking into account the therapeutic alternatives, reasoning on the guidelines and related recommendations in order to make sensible comparisons, are more interesting.
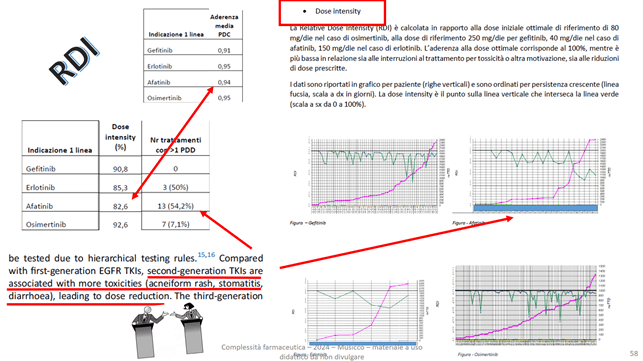
Below is an example of drug comparison using ADH and RDI values as indicators:
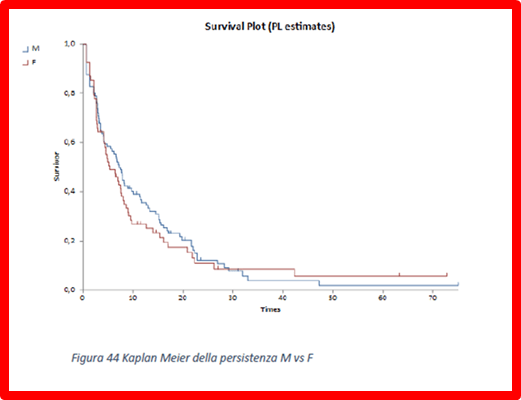
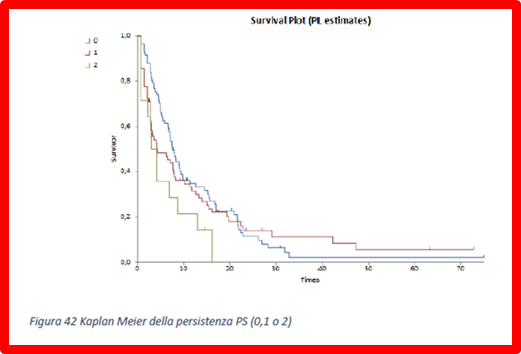
Reports that calculate the Kaplan Meier TTD as a function of gender and performance status of treatments are possible:
An article produced by the FORIERO group analysed the correlations between TDD and TTF (panel A) or PFS (panel B):
In addition, those between low RDI and toxicity:
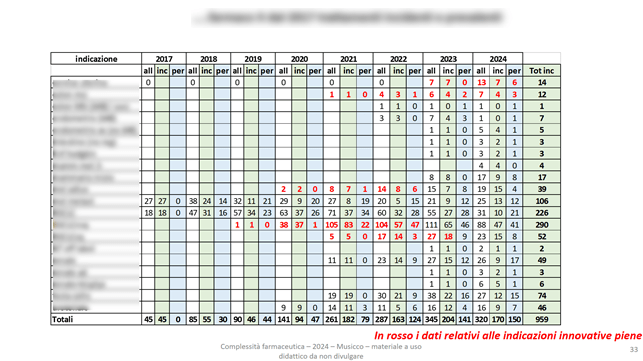
Some of our economic analyses evaluate the incidence and prevalence by drug and indication, also reporting in red the data relating to full innovativeness (specific italian definition) :
As well as the corresponding economic evaluations:
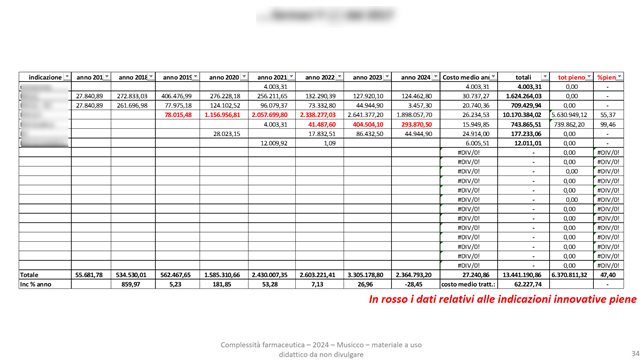
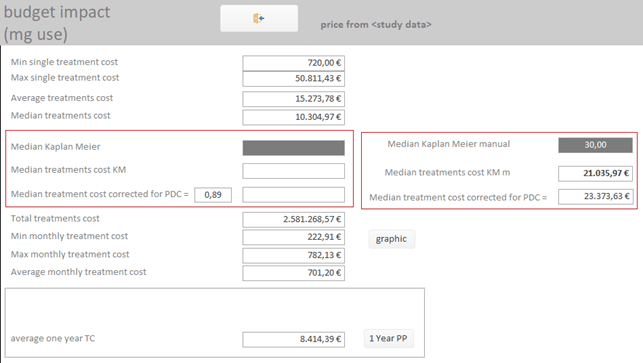
It is possible to calculate the economic impact of a new drug-indication, taking into account the historical cohort data of TTD and ADH:
How to participate?
Write to forierofarma@gmail.com and ask for information on how to join the group, deepen and make practical drug utilization.

Leave a comment