
"drug use, data analysis"
IT tools
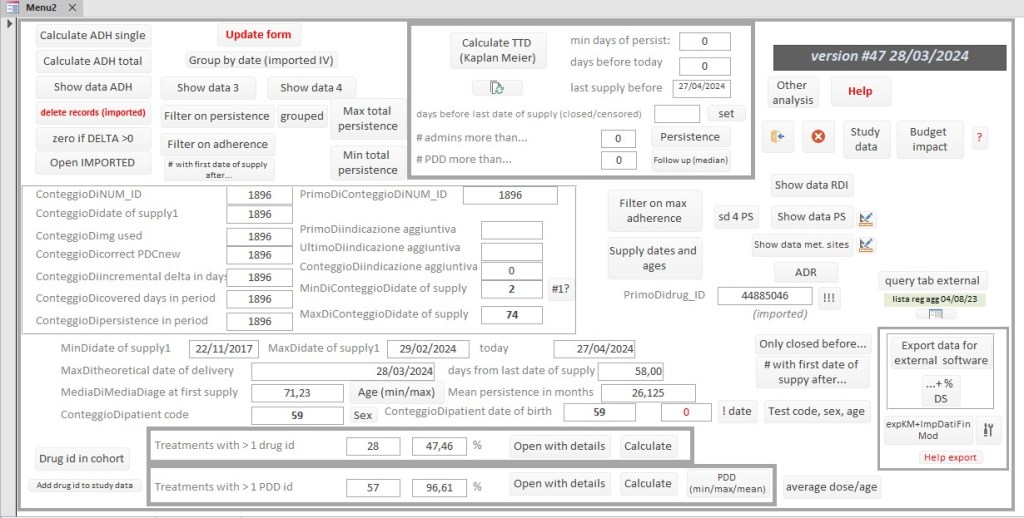
Database
The DB is connected to your data in Excel to group the different packages of the same active ingredient received on the same day for the same treatment. The data is then copied to the green part of the spreadsheet below and the complete final processing is copied back into the DB. Analyzes and calculations are then produced which provide:
- demographic data relating to the treatment cohort (average age, sex)
- the MPR and the PDC, the Relative Dose Intensity, the median TTD with the Kaplan Meier
- the number of dose changes
- information relating to the budget impact
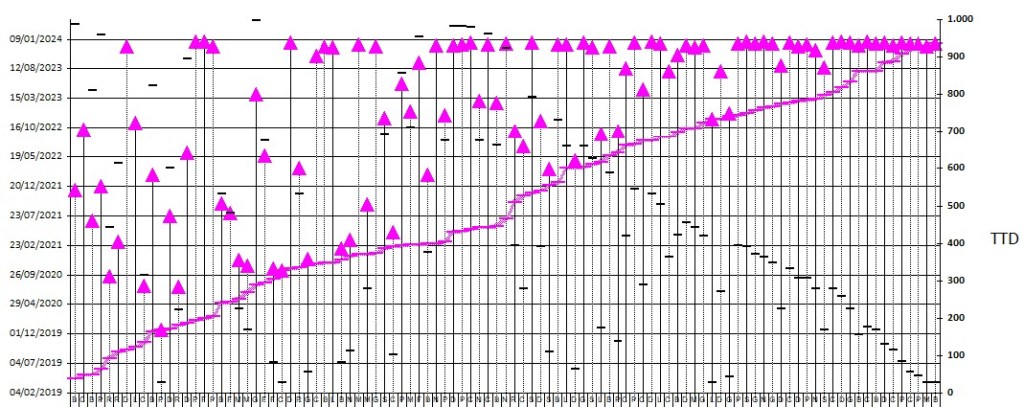
- a graph with the enrollment curve and duration of treatments
- a graph with the adherences and persistence of the treatments
- a spreadsheet that can be used with StatsDirect statistical software ( https://www.statsdirect.com/Default.aspx )
Spreadsheet
The excel sheet, starting from minimum dispensing data relating to the treatment cohort, calculates adherence as MPR and PDC line by line. The calculation is based on an algorithm that counts, based on the PDD and the actual administration dates, the advance or delay in days. The overlap days are subtracted from the adherence calculation if there is subsequently a further loss of adherence due to delays. The data exported from your management system is copied into the green part of the spreadsheet. The other colored columns contain the algorithm and formulas to obtain the adhrences data.

Examples:
Example of enrollment curve with time scale on the left and durations on the right
Example of persistence graph (fuchsia line on the right) – adherences (green line on the left)

For additional information and software requests, use the contact page.
Reserved area with more.